Documentation
New: Export circuit diagrams as AI-readable JSON (.json<).
Open a circuit diagram and choose in the menu File -> Export Displayed Diagram, to write
<diagramName>.json into your work folder (same place as the diagram’s generation infos).
The export includes visible nodes, directed call/access edges, comments, and the set of elements with complete neighbors.
Positions are omitted by default. Requires a Chromium-based browser (File System Access API).
First Steps
Analyze JavaScript coding
Demo
It is possible to display and use demo data. Follow these steps:^Z.*LOG in the input field. This filters for all elements which start with Z and have
a LOG somewhere in the name. You can use any Regex expression. The search is case insensitive.Generate a SOMIX model from files in a local folder
It is possible to analyze folders in the local file system:Use a SOMIX model
When you have a SOMIX model (You will need to use SAP2Moose for now):- Load a new SOMIX model. This will normally not be the model you used before. The diagram will be automatically adapted to the new software version.
- Choose File -> Open Work Folder
- Choose File -> Read Diagram (You will need "Import old Diagram (XML) only when you worked with the Smalltalk version of Moose2Model).
AI-readable JSON Export (New)
You can export the currently displayed circuit diagram as a JSON file (Choose in the menu File -> Export Displayed Diagram,) that is easy for AI tools to consume. The export contains:
- nodes (visible elements) with: id (stable, based on uniqueName), element, technicalType, uniqueName, name, index, and isAddedWithNeighbors.
- edges (directed): kind (call or access), from, to, directed.
- neighborsCompleteFor: the set of elements for which all neighbors are guaranteed to be present in the diagram.
- comments: text notes attached to elements (content only).
How to export
- Open (or activate) a circuit diagram you want to export.
- Choose in the menu File -> Export Displayed Diagram.
- The file <diagramName>.json is written into your work folder (same place as the diagram’s generation infos).
How to export all diagrams at once
If you want a JSON file for every diagram in your work folder, choose in the menu
File -> Export All Diagrams. The application iterates over all .m2m files in the work folder
(and one level of sub-folders, e.g. SOMIX/), loads each diagram, and writes
<diagramName>.json next to it. Existing JSON files are overwritten.
- The diagrams briefly flash on the canvas while they are loaded — that is the progress indication.
- The last loaded diagram remains displayed when the run finishes.
- If any diagram has unsaved changes, you are asked for confirmation first, because the bulk export reloads every
.m2mfrom disk and would discard those changes. - At the end, a single message reports how many JSON files were written and lists any failures or notices that occurred during the run.
- A
README.mdis written into the work folder. It explains the SOMIX model, the file types (.m2m,.json, optional.mdper diagram), and lists all exported diagrams. The file is intended for AI tools that consume the folder. It is regenerated on every run, so do not edit it manually — keep your own notes in a separateREADME2.mdinstead. - The optional
<diagramName>.mdnext to a diagram may be human-written or AI-written; if present, it is referenced in the generatedREADME.mdand never overwritten by the tool.
Minimal example
{
  FileContent": "This file contains a circuit diagram exported from Moose2Model2 to be used in AI. It uses stable IDs based on the SOMIX model element unique names.",
  "m2m_export": "somix-circuit-diagram",
  "version": 2,
  "modelName": "Your SOMIX model",
  "diagramTitle": "MyDiagram",
  "timestamp": "2025-08-26T11:43:33.596Z",
  "neighborsCompleteFor": ["somix:code:sap.y<0>bw_xf"],
  "nodes": [
    {
      "id": "somix:code:sap.y0bw_xf",
      "SOMIXelement": "SOMIX.Code",
      "technicalType": null,
      "isAddedWithNeighbors": true
      "name": "Y0BW_XF"
    }
  ],
  "edges": [
    { "kind": "access", "from": "somix:code:sap.y0bw_xf", "to": "somix:data:sflight", "directed": true }
  ],
  "comments": [
    { "elementId": "somix:code:sap.y0bw_xf", "text": "Hot path" }
  ]
}
Features
General
- Load a SOMIX model
- Read a folder and create a SOMIX model of the contained folders and files.
- Create a new diagram
- Force-dragged positioning. Start and stop with a context click in background of pane
- Scrolling by dragging the pane (with right mouse click)
- Dragging elements (with left mouse click)
- Press G to drag always the group an element is in
- Zooming with the wheel of the mouse
- Menu Model
- Extract a SOMIX model from a folder in the local file system
- Extract Code from File System to SOMIX model (w/o .git). Content in .git folders is ignored.
- Load a SOMIX model
- Explore model (Add elements to diagrams)
- Export model information
- Menu Diagram
- Search elements in the model. The search is case insensitive.
- Remove all highlighting of the displayed elements
- Pin all elements
- Remove all pinning
- Unpin all highlighted elements
- Highlight all not pinned elements
- Export AI-readable JSON of the displayed circuit diagram (
.json)
- Menu Help
- Switch between dark and white theme
- Context click on elements:
- Add an element with all neighbors to the active diagram
- Redo adding an element with all neighbors to the active diagram
- Get information on the element
- Enter or edit a comment for an element
- Suppress an element with all children
- Redo suppressing an element with all children
- Jump to code when a link is contained in the model (For SAP: ADT links have to be activated for Eclipse. For JavaScript: This works currently only when the user adds the paths to the source folder when prompted. The jump may go to the correct line or higher due to limitations in line number detection.)
- Remove pinning of recently dragged elements
- Highlight elements or the using or used elements
- Context click on a grouping – it is also possible to:
- Press G to force that the grouping is selected
- Pin all elements of this grouping
- Unpin all elements of this grouping
- Context click on pane:
- (Only in the diagram with all model elements: Toggle the display of element names)
- Set a diagram active (but not the diagram with all elements)
- Start and Stop Force-directed graph
- Jump to other diagram
- Save information to generate a diagram to file
- Specify a work folder first. This folder contains all diagrams which belong to the same model.
- Save the generation information for the displayed diagram. It is stored in a file with
extension
.m2mand similar name. - Read the generation information from an
.m2mfile. You should have all required model data loaded before. A diagram with identical name is created. - Import XML files from the old Smalltalk version of Moose2Model.
- Export AI-readable diagram JSON — write
<diagramName>.json(circuit diagrams) to the work folder. - Please note that no warning is yet raised when information is lost due to wrong handling.
Header
- Display the diagram which is displayed and which is active.
- Unsaved changes are marked with a bullet point behind the name of a diagram.
Diagram with all elements
A diagram with all elements is always displayed. It can be animated as a force-directed graph. This works well for small models. The main intention of this application is not to make force-directed graphs, so other tools might work better here.Circuit Diagram for Software
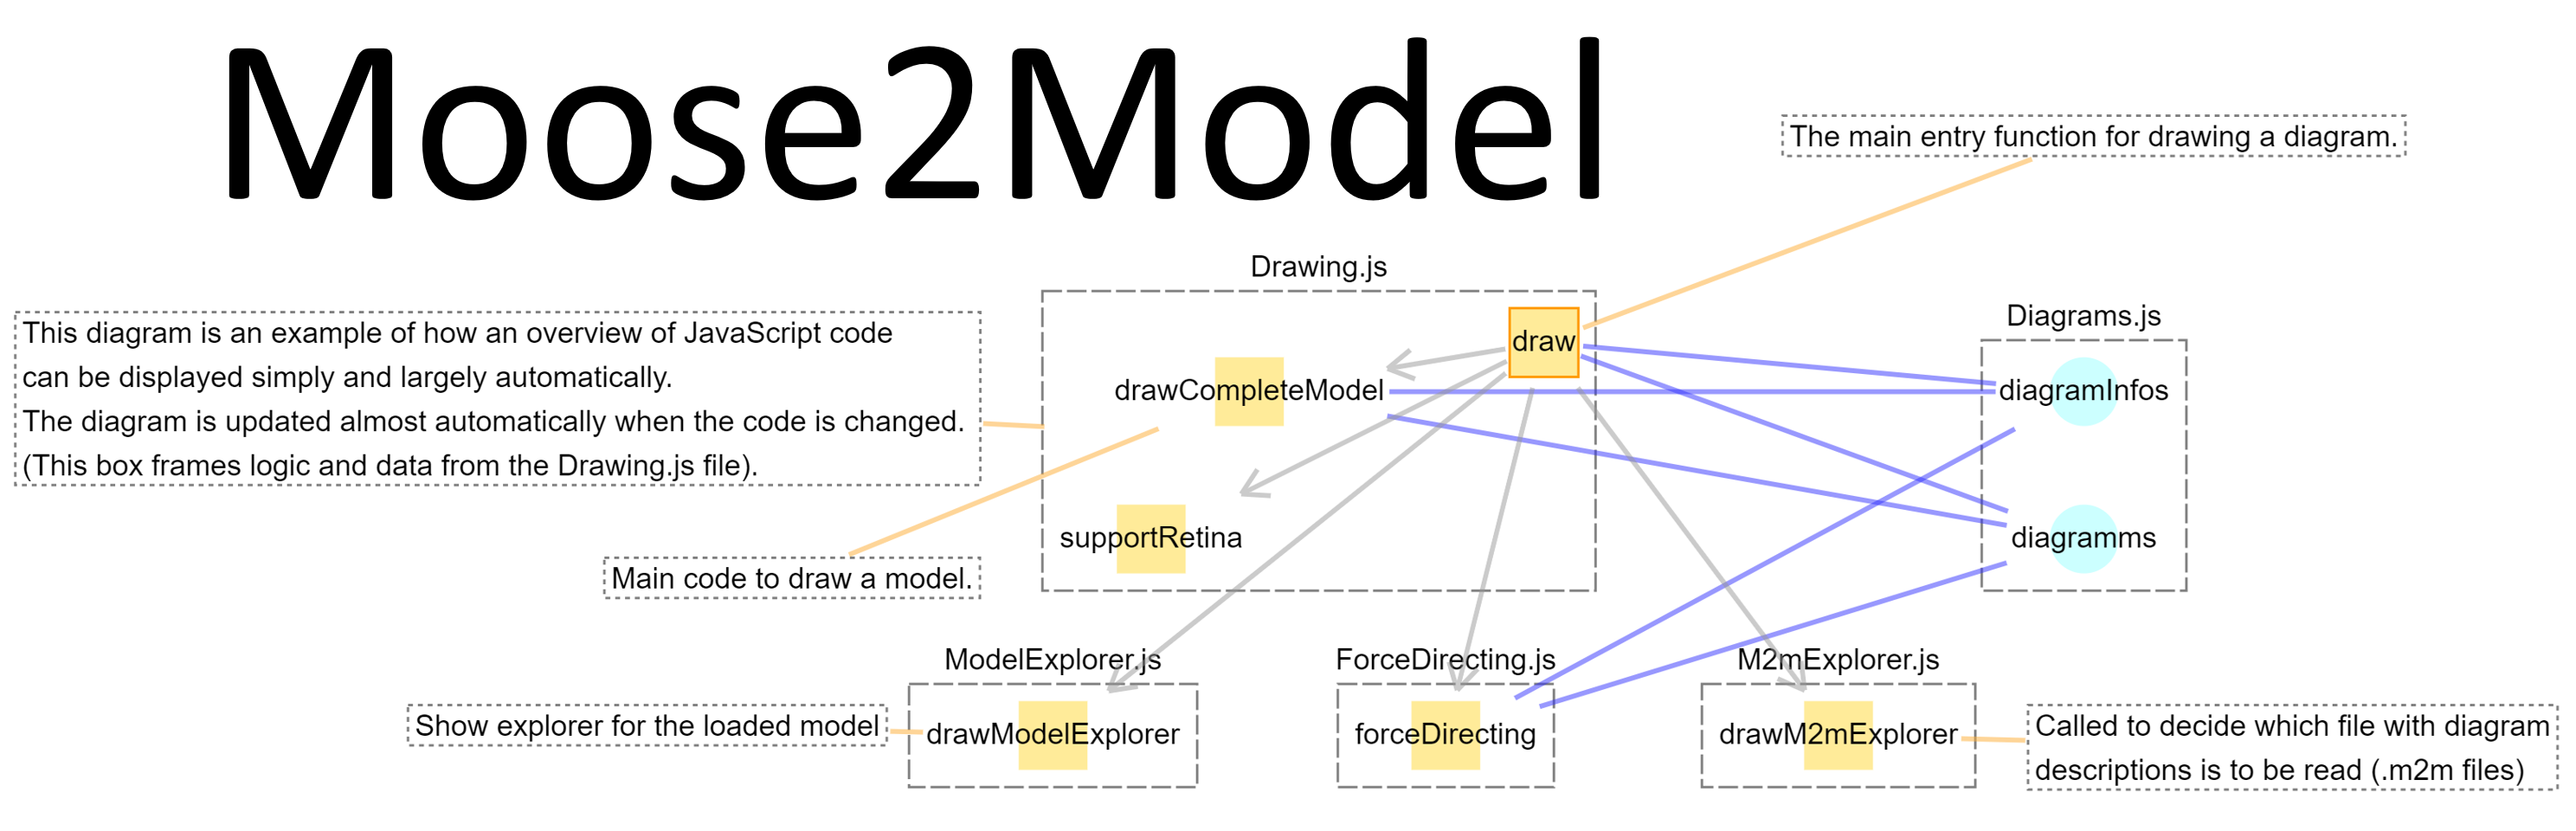
- Code is displayed as orange box
- Data is displayed as blue circle
- Persistent data is displayed as green circle
- Groupings are indicated by a dashed box and include all elements contained in them
- Elements can be commented
- A brighter frame indicates that the element is explicitly added to the diagram